

Project Overview
About
HomeFlow is a student passion project in which solves real life problems for household members by reducing frustration/irritation related to housework and everyday chores.
The project goal is to make it easier for cohabitants and roommates to better communicate and keep track of everyday household chores and to-do’s in their daily life, by discovering a solution to their problems.
Problem
One of the top stressors in a household regards the distribution of housework and everyday chores. It is often a point of conflict in most homes, causing many people to experience frustrations and irritations among the ones they live with.
My Contribution
In this project i had the role of being a UX/UI Designer throughout the whole process. Me and my teammate worked closely together on every aspect of the project, sharing the workload and working as a united team to achieve the success of our project.
Duration
5 weeks
Team
2 UX Design students
Tools
Adobe XD, Figma, Miro, Google Sheets, Google Forms
Solution
Create an application that makes it easy for household members to keep track of their everyday chores, events, messages and shopping lists. In addition to motivate members to contribute more with their assigned housework.
Process
The design team followed the Design Thinking process in ensuring that we were putting forward a user-centric design in which solves real life problems for our target group.

Empathise
Step 1
The first step of the Design Thinking Process were to empathise with the potential users, to define the root cause of the problems the product needs to solve. The team gathered qualitative and quantitative data by conducting primary and secondary research methods to obtain valuable data. Understanding whom we are going to solve the problem for as well as their experiences, goals, needs, frustrations and motivations.
Research
Research Goals
What
would motivate the user to use the product?
When
will the user benefit from using the product?
Where
will the product be used?
Why
is the product important for the users?
Who
are the users of the product?
How
can the product help the users?
Research Methods
Secondary Research
1
2
Literature Reviews (Qualitative and Quantitative data)
-
Collect facts from various sources on the internet, to discover answers to the 5W and H questions.
Competitive Analysis (Qualitative and Quantitative data)
-
Understand and analyse our competitors to gain a competitive edge in the market.
Primary Research
1
2
Interviews (Qualitative data)
-
Conduct semi-structured interviews with 5 participants satisfying recruitment criteria.
Survey (Qualitative and Quantitative data)
-
Send out a survey to reach a larger population of people living in Norway (51 responses).
Data Analysis
Based on the collected research data, the design team used empathy mapping and affinity mapping to get a better understanding of our users in addition to turning our collected facts ito meaningful insights, with the use of adductive reasoning.
Empathy Mapping
Affinity Mapping

Key Insights
Based on the insights uncovered from the data analysis and synthesis process, the team got a better understanding of the potential target group. Viewing their goals, pain points, challenges, emotions, and needs regarding housework and everyday chores. We created some recommendations to guide our project based on the insights we uncovered.
Recommendations:
-
Help people in organizing and getting a better plan and overview of their housework and everyday chores.
-
Create a solution in which includes features such as lists they can tick off as they complete tasks/chores.
-
Make a fun way for people to keep track of how much each member contributes with housework and everyday chores in the household.
-
Could increase motivation by including a points system and statistics in the solution, making it more fun for the household members.
Step 2
Define
The second step of the Design Thinking Process deals with identifying the central design problem that needs solving and for whom we are solving the problem for, grounded on the research data collected from the empathise step. Defining who our users are, what problem we are trying to solve and why we are trying to solve it.
Point of View Statement
People who live with others needs a way to motivate themselves and those they live with, to contribute to doing more housework and everyday chores in a fun and efficient way, because the distribution is an issue which often leads to a lot of frustrations and irritations within the household.
Vision Statement
Our longterm vision is to provide our potential users with an application that could help them in making their daily life a bit easier, regarding distribution of housework and everyday chores.


Step 3
Ideate
The third step of the Design Thinking Process relates to exploring various ideas in establishing a solution to our defined problem, meeting our users goals and needs. The design team ideated on possible solutions before selecting the top solution, and defining its requirements, information architecture, UX flows and sketches.
How Might We...
motivate/inspire users to contribute more with housework and everyday chores?
help the users in their everyday life?
make distributing tasks and chores more organised?
make people's everyday life easier?
make our product differentiate from already existing solutions?
Brainstorming
To ideate as many ideas as possible in a short amount of time, while finding the solution to our problem, the design team used the ideation technique; brainstorming. Every idea were thereafter ranked with the use of the $100 test technique, to prioritise the set of ideas.

Solution
The solution to our problem is to create an application that mainly focuses on the most essential functionalities when it comes to living with others in a household. Giving the users the opportunity to keep track of their everyday life, such as housework and everyday chores, planning dinner, shopping lists, calendar, etc. To get more organised, the users are able to check off when chores and so are completed. The application will include functionalities regarding an in-built point system in which gives each household members points for completed chores, as well as an in-app communication system where each member of the household can easily send messages to each other directly from the app.
Moodboard
In virtue of the solution, the design team decided on conducting a second ideation technique, searching the web for inspiration and pictures to create a mood board.
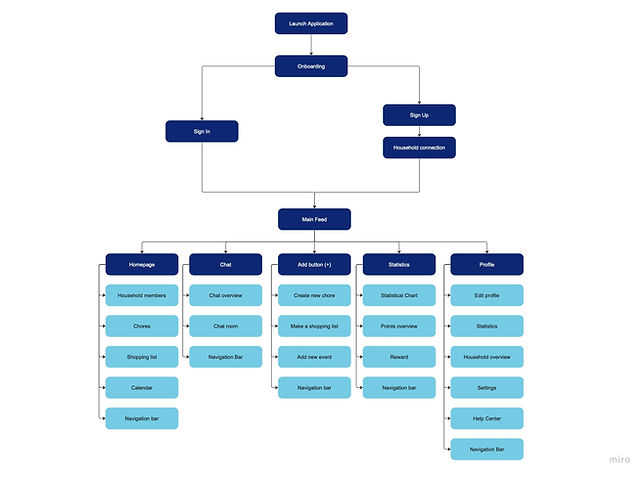
Information Architecture (IA)
The design team created an information architecture focusing on the organization of content, illustrating the navigational structure.
User Flows

Scenario: Silje downloads the app, creates an account and is now ready to connect with her household members.
Scenario: Silje has created an account and connected with her household members. She is now ready to get started and add new chores to her list and distribute different chores between all household members.
Solution Sketches
The team sketched out various ideas for our application design early on in the project, based on our Requirements, IA, and UX Flows. Focusing on the core sections of the application, which were most suitable for our design vision and concept design.
Step 4
Prototype
The fourth step of the Design Thinking process is prototyping, by visualising and conceptualising the solution with sketching out low-fidelity wireframes and prototypes.
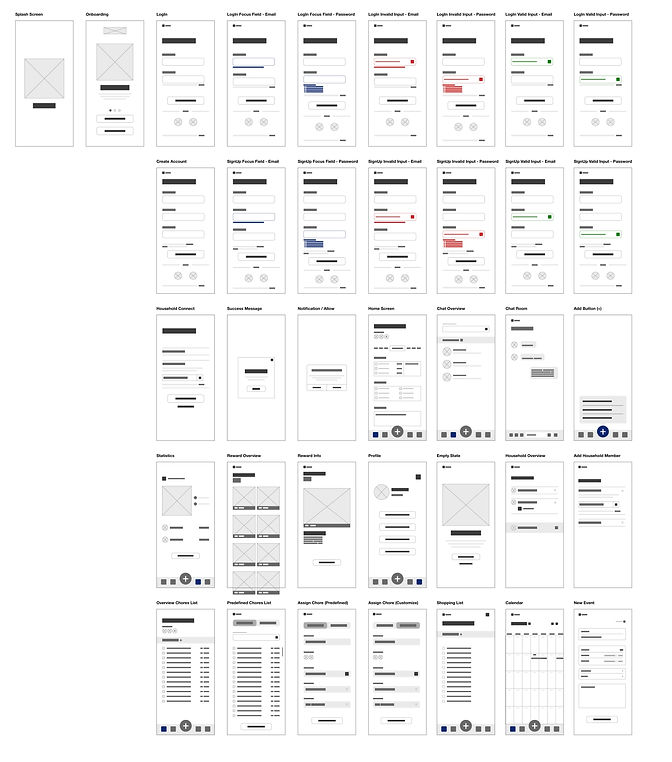
Low-Fidelity Wireframes
The low-fidelity wireframes shows the what, where and how of the application design early on in the project. Focusing on the core functionality, layout and hierarchy, designing for the personas goals and needs

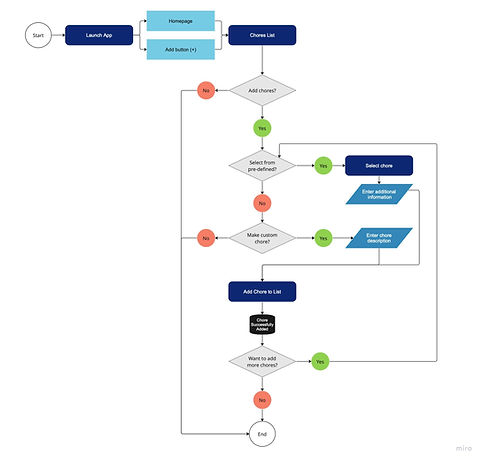
Wireflow
Quick Walktrough of the low-fidelity prototype:
Low-Fidelity Prototype
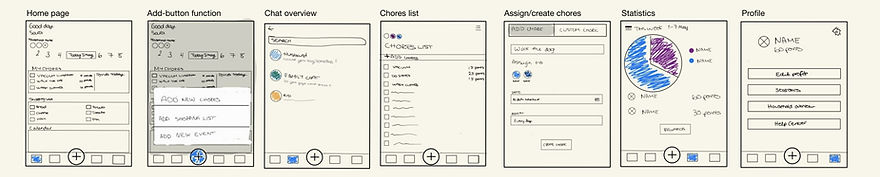
The low-fidelity prototype were created by refining the low-fidelity wireframes with additional details, such as beneficial headings/text, icons, and button labels creating a somewhat mid-fidelity feel of the application
Do you want to try out the prototype?

Step 5
Test
The fifth step of the Design Thinking process is to test the low-fidelity prototype with potential users of the application. Identifying usability issues early on in the project that needs to be improved, in creating a pleasurable user experience.
Usability Testing Sessions
The first round of usability testing sessions were conducted with 5 testing participants. The testing sessions were of a task-based first testing type, which were in-person/remote, exploratory, scripted and moderated with the use of the moderating approaches: concurrent think aloud and retrospective probing.
Goals
-
Understand how users interact with the app.
-
Discover user problems, issues or errors.
-
Obtaining valuable feedback on usability.
-
Establishing benchmarks for future testing.
Tasks
-
Creating an account and connect with household
-
Add new chores/shopping items/events in the application
-
Check statistics/points and get a reward
-
Add a new member to household
Metrics/Key Performance Indicators
-
Completion Rate
-
Completion Time
-
Error Rates
-
Satisfaction Ratings (SUS Score)
Test Data Analysis
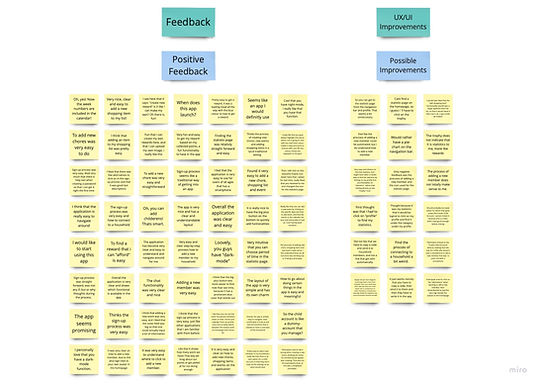
The collected testing data from our testing sessions were obtained in a combined spreadsheet, and analysed with the use of affinity mapping to turn the facts into meaningful insights that we could act on in improving our application design.

Testing Insights
1
2
3
4
Most of the participants liked the add-button placed in the center of the navigation bar, for a quick and easy way to add chores, shopping items and events.
Some participants wishes for more information and instructions on how to connect to a household and to add a new member to the household.
Some participants wishes for more functions on the shopping list, such as favorite shopping items, and being able to click directly on the shopping list to add new items like in notes.
Some participants wanted to add new events by clicking on the desired date in the calendar, as well as view the week numbers.
5
6
7
8
The tab bar icon (pie chart) in the bottom navigation bar were for someone a bit hard to understand and locate to find the statistics screen.
The sign-up process were intuitive for the majority of the participants.
Improve the chores overview to include the functionality of seeing every member in the household’s chores, as well as being able to «steal/complete» chores for other members.
Most of the participants find the application intuitive and easy to understand and use.
Iteration
Prototype
The design improvements discovered from the first usability testing sessions were iterated on in further developing a polished high-fidelity prototype of the application.
Design System
Before commencing on creating the high-fidelity wireframes and prototype, the design team created a design system for our application; HomeFlow. The design system helped us in staying true to our branding and interface elements in designing a consistent, easily understandable and clear user interface.
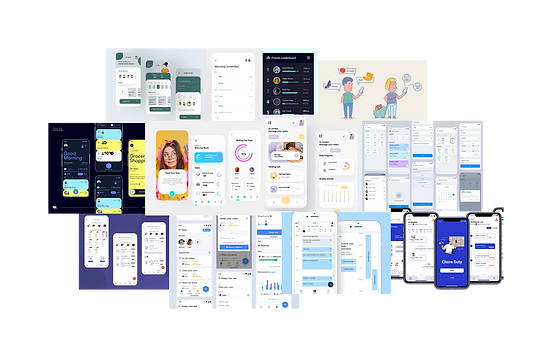
High-Fidelity Wireframes
Selection of the high-fidelity wireframes main pages of the HomeFlow application:

Quick Walktrough of the high-fidelity prototype:
High-Fidelity Prototype
In creating the high-fidelity wireframes and prototype, the team used the design system extensively in ensuring a consistent, understandable and clear user interface for our users, in addition to iterating on the design improvements from the insights uncovered during the first round of usability testing
Do you want to try out the prototype?

Iteration
Test
In order to discover if the new changes from low- to high-fidelity improved or not, the team conducted a second round of usability testing with the high-fidelity prototype.
Second Round of Usability Testing
The second round of usability testing were conducted with the same script, testing types, testing metrics, and participants as the first round of usability testing. The team found it beneficial to conduct the sessions with the same starting point as the first testing sessions, to see if the application design had improved and if there still existed design improvements. The testing data were analysed with the use of affinity mapping to uncover meaningful insights.
Metrics and SUS Score Comparison
First vs. Second Round of Usability Testing
There was a clear and obvious improvement from the first to the second round of usability testing, relative to the tracked metrics/key performance indicators and overall SUS Scores.
Metrics
First Round
Second Round
Direct Success:
Indirect Success:
Failure:
Error Rate:
23
7
0
8
Direct Success:
Indirect Success:
Failure:
Error Rate:
30
0
0
0
SUS Score
First Round
Participant 1:
57,5
Participant 2:
97,5
Participant 3:
62,5
Participant 4:
97,5
Participant 5:
87,5
Second Round
90
100
90
95
100
Testing Insights
1
2
3
4
The participants express that they think the app is clear, intuitive and easy to use.
Participants find it easy to add new chores, shopping items and new events.
Participants have divided opinions about which icon that would be the best fit to represent the «statistics» page in the bottom navigation bar.
Some participants clicked on «create child account» without thinking, when they weren’t supposed to click it, didn’t read good enough before clicking.
5
6
7
8
Some participants found it intuitive to find their statistics via their profile, and others through the navigation bar.
A participant wanted that the «add shopping item» to have a larger typeface than the rest of their shopping list.
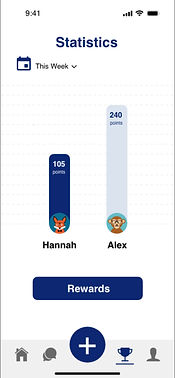
A participant though that it would have been easier to read the statistics chart if it would have been a bar chart instead of a pie chart.
A participant expressed that they did not think the process of adding new member was intuitive. Might consider adding an additional way of adding.
Design Improvements
Grounded on the insights, the team found some improvements that needs to be iterated on in the application design.
Navigation Bar
Original Design:

Recommendations:


Add Shopping Item
Original Design:

Recommendation:


Statistic Page
Original Design:

Recommendation:
Add Household Member
Original Design:
Recommendation:

Step 6
Implement
Looking towards the future for the HomeFlow application, firstly there needs to be conducted further iterations of the application design, to implement the new suggested improvements and test them with users. In addition to teaming up with a development team to develop an operative and pleasurable application for our users.
Next Steps:
What i learnt:
During this project i have learnt that the design thinking process is a valuable tool to follow in creating a user-centric product, and that testing early on in the project is crucial to initiate further iterations of the application
Thank you!
for taking your time to view my project